Thanks to everyone who left comments on the last post, Learning to See in 2023. You are making me think.
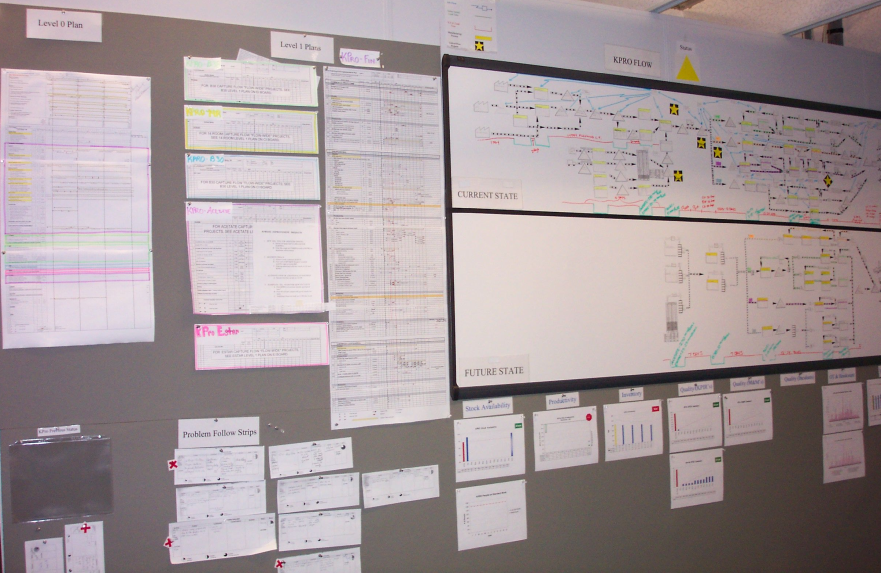
Although Learning to See (the book) describes building your value stream map on A3 / 11×17 paper, most of the maps I have seen have been large affairs on a wall.
I like this approach because it shifts people into the position of standing side-by-side talking about what is in front of them, which fosters collaboration.
The question in the title, though, is more about whose wall is it? Who sees this every day, who is standing and talking about the current state, the future state, and steps to close the gap between them?
I usually see these in the Continuous Improvement team’s workspace. That was certainly the case for the one in the photo. Sometimes they would bring management into that room to discuss progress, but all too often that became a report-out to the managers.
And right there we have an interesting situation: The Continuous Improvement Director and his team have a much deeper understanding of what was going on than the people in charge.
This was partly because it was the Continuous Improvement team members who made these maps in the first place. And they were the ones tracking the metrics, including quality, productivity. They were the ones identifying the problems, and they were the ones working to solve the problems.
And they were the ones complaining when things eroded because management “wasn’t supporting the changes.”
As a Continuous Improvement team (and if you are reading this, that is likely you), your ultimate goal is to enable the line leaders by engaging through them rather than engaging for them.
You likely have to get there step-by-step, with successive target conditions, but it is the level of engagement of those leaders, and their growing competency in doing so that you and your C.I. team should be tracking on your walls.
Pat’s comments on my last post reminded me of another post I had written a decade (!!!) ago titled Learning to See in 2013*. I think it is time for reflection and an update. That being said, I think the 2013 post has actually aged pretty well. I don’t see anything in it I would retract, just some things to further clarify or amplify.
Of course that implies that we (our community) is still largely stuck in the same groove we were a decade ago. *sigh*
Let’s ask some questions:
Who is “Learning to See?”
The first time I made a real value stream map was in 1999. A plant manager asked me to build a map of the flows in his factory. I spent three or four days talking to his area managers to get their understanding, observing flows on the shop floor, getting actual cycles, comparing what I observed with what those managers thought was going on.
With all of that information, I mapped out the factory’s flows. It took four 11×17 (A3 size) sheets taped together to depict what happened as raw steel came in one end of the building and was cut, bent, welded, painted, and assembled with purchased components into the final product.
I learned a lot, not only about mapping a process, but about the way this factory functioned, and had pretty compelling evidence that the bottleneck was not what the common knowledge said it was.
I dutifully presented my findings to the plant manager and his continuous improvement manager. And things pretty much ended there.
Years later, another plant manager asked me to come out to their site and map their value streams. This time I was pretty insistent that though I was happy to come out and facilitate the process, it really had to be the site leaders that were doing the observations and building the map. What they wanted, though, was for me to report my findings to them once I was done. I still scratch my head about that one as the General Manager was an ex-Toyota guy who knew better.
Which brings us to:
Who is mapping the process?
Regardless of what structure you use to map your process (VSM, Swim Lanes, SIPOC, to name a few), the learning comes from the experience of building the map and then having to explain it to someone else.
That second bit is important: If you can’t explain it to someone else, you probably don’t understand it as well as you thought.
So, if you are a consultant or internal change agent, and you build the map and then try to explain it to management, guess who learned the most? (Hint: It wasn’t your audience.) The key point here is if your objective is for the line leaders to gain insight into what is actually happening, you are unlikely to accomplish that objective by explaining it to them. They will never gain as much insight as you did.
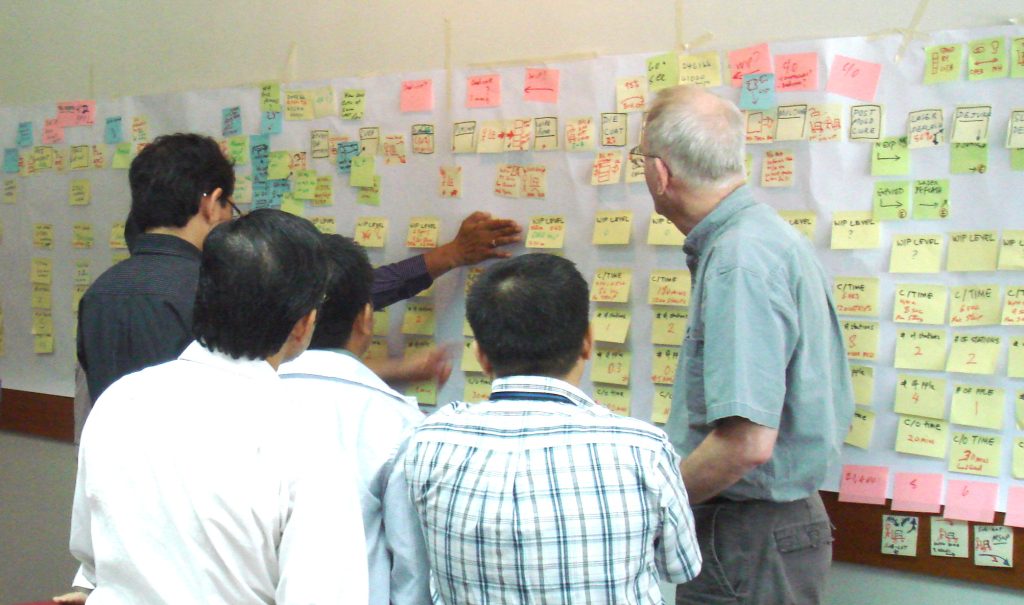
In the photo above, it is the operational leaders who are explaining what they are learning to me. I’m just asking questions until I understand. They ended up going back out to the shop floor more than a couple of times as the picture came into focus.
Why are you mapping the process in the first place?
I asked this question in the 2013 post: “Why are you doing this at all?” with a context of having some kind of strategic intent, a challenge, in mind.
If there isn’t a concrete challenge or objective in place, this quickly turns into a “What could we improve?” exercise followed by a calculation about whether it is even worth going through that effort or might be cheaper to just outsource the entire thing to a “low wage country.”
But there is another, more tactical, reason to ask this question.
If your step was “Make a value stream map,” then “What do you expect as a result of taking that step?”
I have heard responses such as “I expect the leaders to see what they need to fix.” That, actually, is a testable outcome if you do so with intent. But if you are frustrated that, time after time, a current state process gets mapped and then nothing else happens, then it might be time to ask “What am I learning?”
This kind of brings us back to the importance of that overall strategic intent, because that is what drives the necessity to then build a possible future state map that, if we can operate that way, will deliver the results we need. From that we can establish challenges for individual local leaders and work with them (coach them) toward reaching those challenges.
Again – this is all a lot of work. And it is hard. Thus it is equally important to understand that the higher level goal here is to build capability and competence within your organization. If you forget that part, then it is all to easy to just outsource the mapping (see the beginning of this post) or, worse, outsource your entire value-add chain.
*The title of that post, and this one, is based on a groundbreaking book by Mike Rother and John Shook, Learning to See. Published in 1999, it introduced the term “value stream map” into the vernacular. And it was the first significant publication of the then newly-formed Lean Enterprise Institute. I think Learning to See actually had the impact of establishing a genre – practical application workbooks that sent beyond just discussing benchmark examples and general principles.