Takt Time: How Slow Can You Go?

A long, long time ago – in the days when computer programs were coded as holes in punch cards – I was in ROTC* in college. Twice a year we had a “PT” (Physical Training, I think) test that consisted of measured performance on five “events.” One of those events was a 2 mile run. To get a maximum score of 100 points, the participant had to complete the 2 mile run in 14 minutes and 9 seconds. Why? I have no idea. But that was the way it was.

Yes – this old school stopwatch reads exactly 42 seconds.

My buddy John and I enjoyed running, and would often work out together. Our school was in Potsdam, New York, a place known for rather brutal winters, so we ran on a 1/10 mile indoor track.

We practiced the PT test. John would track our total time for 2 miles (20 laps around the 1/10 mile track). I would measure lap times. Since 14 minutes is 840 seconds, we knew that if we could consistently make 42 second laps, we would complete two miles in 14 minutes, and get the maximum score with 9 seconds to spare.

The track had hash marks at each quarter point, so we knew we had to hit quarter 1 between 10 and 11 seconds, half way at 21, the 3/4 mark between 31 and 32, and the lap at 42. We would check and adjust our pace accordingly, striving to hit exact 42 second laps every time.

To be clear, we could hold that pace many times further than 2 miles. It wasn’t a matter of conditioning. We weren’t going all out. We were going fast enough. And that was the point.

When we took the test, other cadets were going all out, passing us, and turning in much faster times. Others would try to “pace themselves” and then sprint as fast as they could for that last lap. As a general rule, although the instructors were calling out elapsed times as people went by, these cadets weren’t all that aware of the speed they had to hold. They were just going as fast as they could.

Meanwhile, John and I, running together, and tracking our cycle times (lap times) vs the takt time (42 seconds / lap) would come in at pretty much exactly 14 minutes and get the same score as everyone who had finished ahead of us: 100 points.

After our timed run was done, we would keep running, offering encouragement and pacing for those cadets who were struggling a bit. Everyone finishes, nobody left behind.

A couple of the instructors were curious why we didn’t go for a faster time. And many times we did when we were just working out. We were capable of breaking 12 minutes – not competitive times in a track meet, but respectable. The simple fact was that going faster wasn’t necessary to accomplish the goal.

Takt Time and Cycle Time

This is the whole point of having a takt time. It answers the question, “How fast must we go?” It doesn’t answer “How fast can we go?” nor does it answer “How fast should we go?” I fact, John and I could have run those laps almost (but not quite) half a second slower than we did – which would have eaten into the 9 second buffer we established. Aside from making the math easier, that buffer also gave us a small margin for even something as bad as taking a stumble and standing back up. Also, of course, we could make up 5-10 seconds a lap if we really had to. But we never did. Time: 14:00. We were very consistent.

Rate vs. Output

I encounter a lot of production managers who are so conditioned to focus on the daily output that they don’t even think about the critical factor: How fast are you running vs. how fast do you need to run? In other words what is your rate of output vs. your takt time?

Instead they tend to, at best, count units of output without really paying attention to the time interval between one and the next. In the worst case many units are started at once, and people swarm from one operation to the next during the day – the equivalent of that mad sprint trying to make up as much time as possible. They don’t really know if they will succeed or not until the end of the day (or month!).

It Isn’t a Race

The “just” in “just-in-time” is “just enough resources” to “just make the output you need” in any given time interval. As the operation is streamlined, the same effort is able to accomplish more. Where to put that additional capacity (which costs nothing additional since it has been there all along) to create more value should be the challenge the organization is trying to meet.

My experience has been that managers and leaders often struggle to adopt this “rate” mindset and let go of chasing an inventory number. In the words of the late great philosopher Kenny Rogers – “There’ll be plenty of time for counting when the dealings done.”


*ROTC (Reserve Officers Training Corps) is a U.S. program where college students can earn a commission in the U.S. Armed Forces while earning their degree.

Who is Grading the Questions?

Once again the search terms have revealed an interesting test question. Let’s parse it and see what we can learn.

2. the cycle time to complete a final step on an assembly line is normally distributed, with a mean of 4 minutes and a standard deviation of 1 minute.1) at the end of an 8-hour shift, how many units will have been assembled on average?

The question is about exit cycles – the cadence at the output of a production process of some kind, in this case an assembly line.

Measuring and plotting the variation of exit cycles at the customer end of your production process is a great way to get a handle on how much variation there is.

This question, however, reveals a level of simplistic understanding in the mind of the person who wrote the question of how these things work.

Answering the Question

First, we have to assume that this assembly line (which implies manual work) takes no breaks during their 8 hour shift. We have no information that suggests otherwise.

That means we have 8 hours x 60 minutes = 480 minutes of working time.

Intuitively, if the exit cycles are normally distributed (which implies the distribution is symmetric), with a mean of 4 minutes, then we should be able to simply divide to get the average number of units built during each shift.

480 / 4 = 120 units

Which in the long-haul is close, though it will take a lot of iterations to converge on that. Running about 65 iterations of a random number set with a mean of 4 and standard deviation of 1, I got an average daily production of 120.1, a high of 127 units, and a low of 115.

But Exit Cycle Times Aren’t Normally Distributed

This is a problem with a lot of the “statistics” I see being kicked around today.

This is a histogram of 36 actual exit cycle times from a real production line.

image

The “Cycle Time” bucket numbers on the horizontal axis represent the top of the range. So the high bar says there were 10 cycle times between 25 and 30 seconds.

The mean of the data set is 42, which is actually one of the less frequent values.

The first thing that jumps out is that this data set might have two peaks (be bimodal). I would want a lot more data before I drew this conclusion, however let’s assume it is for the discussion because this is quite common.

A bimodal distribution implies there are two different processes running. If we looked at a run chart of individual cycles, we would probably see one of two things:

  • Clusters of longer times spaced between clusters of shorter times. This would be the case if the line is running lots or batches, then switching over.
  • A repeating cadence like “short-short-short-long, short-short-short-long” which would indicate really good production leveling.

But all of that is a sidebar. The real issue I have with this “homework question” simple: Cycle times are (almost) never normally distributed.

There is a minimum time that can elapse between the completion of one unit and the completion of the next, but there is no theoretical limit on the length of delay. These distributions (almost) always have a tail to the right.

So once again, be very careful about blindly using averages (arithmetic means) unless you understand the whole story.

The Test Question Misleads the Students

And this is my problem with questions like this on exams and homework, especially in classes that purport to be teaching how factories run. Even when using a distribution, the problems almost always default to a symmetric distribution when real world factory-related data sets are rarely symmetrically distributed.

You are teaching your students a simple solution that won’t work in the real world without explaining why.

Cruise Ship Cabins on an Assembly Line

Royal Caribbean Cruise Lines released a cool P.R. video showing the production of cruise ship cabins on an assembly line with a 14 minute(!) takt time.

The key point, for me at least, is that even “big one-off things” can often be broken down into sub-assemblies that have a meaningful takt time of some kind. We have to look for the opportunities for what can be set up to flow vs. reasons why we can’t.

Click Here for the direct link to the page on Royal Caribbean’s press page.


Takt Time: Let’s Do Somebody’s Homework

On the back end of this site, I see the search terms that landed people here. This one showed up yesterday:

"a packaging process works two, 8 hour shifts per day. there are two 15 minutes breaks per shift. daily production requirements are 240 packed units, with a planned machine down time of 30 mins per shift, team has to work 60 mins overtime per shift, it is a 4 member team – calculate takt time"

OK, readers, let’s help him out. What’s the answer?

Why is this phrasing ambiguous if the author of the question is looking for a “right” answer?

Takt Time Is Local

There was an interesting search in my logs today.

[does a system have a single takt time or multiple]

I always figure that if one person is looking, others are also curious, so let’s address it and maybe there will be a better search result for the next Googlenaut out there.

Takt time is local.

It is calculated based on the demand from your customer.

This is a critically important concept because for takt time to be of any use, it has to be relevant to the people who are actually doing the work.

Example 1:

A factory has four final assembly lines that feed into shipping.

There are 420 minutes of working time in the day, and total aggregated leveled output is 350 units of production.

What is the takt time?

For shipping, it is straight forward. The customer takt time is:

420 minutes / 350 units shipped = 72 seconds

So for shipping to stay on task, their process must be capable of packing and loading one unit every 72 seconds. If they can’t consistently achieve that, they are falling behind.

What about the assembly lines?

You don’t know, because you don’t know what each of them is expected to produce. You could say that the factory takt is 72 seconds, but that does not pass the “so what?” test for the people working on those lines. But if you know that:

  • Line A’s leveled production is 75 units
  • Line B’s leveled production is 50 units
  • Line C’s leveled production is 100 units
  • Line D’s leveled production is 125 units

then you can determine a meaningful takt time for each of those lines.

  • Line A: 336 seconds
  • Line B: 504 seconds
  • Line C: 252 seconds
  • Lind D: 201 seconds

In reality, I am going to run these lines a little faster, but that is a different topic entirely.

Now we have a takt time that actually matters. It reflects the work cycle that must be achieved for that line to meet its obligation to its customers.

Example 2:

Upstream there are fabrication or other feeder processes. We have not yet gotten them into directly linked flow.

Process E feeds one part to each unit produced on Line B; and one part on every FIFTH unit on Line C. What is the takt time?

Line B needs 50 parts. Line C needs (100 / 5 =) 20 parts for a total of 70 units of output.

So Process I has a takt time of (420 minutes / 70 units of output =) 360 seconds.

Value stream mapping is very useful for untangling this. Hopefully you can also start to see one of the reasons we work so hard to level volume and mix.

This isn’t complex stuff, but on the other hand, if you oversimplify it then it becomes meaningless. Remember, this is not about OUTPUT, it is about testing whether your process has succeeded each and every time it is carried out. You can only do that if you know what is expected right then and there.

Go to your shop floor. Watch the work. Can you tell, with each unit of output, whether the team member was successful that time? (More precisely, can you tell whether you were successful in giving that team member what she needed to succeed!). If you can’t tell, I guarantee that the people doing the work have no idea, which means you are leaving them to guess. Not a good thing.

Taktzeit

Now and again someone wonders out loud why, in this lexicon of Japanese terms, we have the word “takt.”

I had always passed along what I had heard – that the word was German, short for taktzeit and used in their factories to represent the pace of production. During WWII, the Germans had helped the Japanese set up more efficient production lines, and the word migrated into Japanese usage.

All of this had been anecdotal.

factory_floor07But today I ran across Alan Hamby’s phenomenally in-depth reference site on the German WWII Tiger Tank. Alan has extensive detail on the Henschel Tiger Tank Factory, and in some of the photos are signs indicating the number of the “takt” or production position.

But don’t stop here. Take a look at Alan’s site, and look at how this factory is set up and operated. This plant was set up to produce a Tiger I tank every six hours, and built a total of 1375 of them between 1942 and early 1945. Yes, there is a lot of waste, but bluntly, I have seen 21st century factories making products of similar size and complexity that are far worse than this.

The idea of pacing and balancing production is not new. By the time these photos were taken around 1943, the concept had been proven for over 20 years. Yet when I visit factories today this is a seemingly novel concept. I always wonder why today’s operations managers are not insisting on at least the efficiencies that were achieved by 1935.

Thanks to Alan for his kind permission to bootstrap from his research and use these rare photos here.

Just to be clear, though, having a pace for production does not make a line “lean.” Far from it. But it is a foundational element. It may not be sufficient, but it is (in nearly all cases) necessary. What makes it foundational element for improvement, however, is not so much the pacing and balancing aspect. Rather, the concept of takt time can be used as a way to structure improvement goals and targets in a way that is meaningful to the people doing the work.

We talk a lot (all to much, in my view) about metrics, but tend to think of the things management is interested in – like labor productivity. But the way you get labor productivity is to focus on the takt time, the total cycle time, and the stability of that cycle time. Those are the things that determine how much gets done by how many people. You can measure “labor productivity” all you want, but you can’t change it unless you get down another couple of levels. Fortunately (for us) Reichsminister Speer didn’t figure that out.

By the way, just to put things into perspective:

In 1943, Boeing Plant 2 was producing one B-17 bomber an hour, sixteen planes a day, six days a week. They did it by using a paced assembly line and continuously working to simply and improve the flow.

Genchi Genbutsu in a Warehouse

Now and then something comes across that makes it all worth it. And nothing is more “worth it” to me than to know something I said or did contributed to someone’s insight or impetus to do something spectacular.

Yesterday Earl sent me an email that is one of those times. I was going to edit it from an email to me into a story about Earl’s experience. But instead, I decided to just publish it (with his permission) pretty much as I got it. But to be clear, this is about Earl, and his learning, not about me or my teaching.

Mark,

I received this email [see below] the other day from John.

John was one of the lean leaders working for me in Rochester when I was the Lean Director for Kodak’s Global Logistics team and you were the Lean Director for Equipment Mfg. He is now a professor at RIT teaching lean.

One of the things he does with every class is bring them through his old operation in Kodak. The operation is an outbound crossdock for all of Kodak Park where, through applying our lean principles, primarily “flowing at takt”, we have taken a 2,000,000 square foot (186,000 m2) warehouse and replaced it with an 85,000 square foot (<8000 m2) crossdock.

Along the way we reduced the costs by 70%, improved the reliability to +/- a few hours, and amassed an enviable safety record….and as you can see in his note, we’re making it better every day.

When I think back to how we got here, I have to go back to what started as an innocent Friday night, when you, Paul Cary, and I were sitting around his office and you and Paul were pushing on me that we weren’t really thinking about lean in the right way in Logistics, and I was pushing back that “you didn’t understand”….that we just move pallets around the warehouse.

I can remember like it happened yesterday, but it was actually a few years ago, you and Paul looked at each other, looked at me, jumped up and said “Let’s go see”, so we did.

Several hours later, we emerged from the warehouse, not tired and worn out, but energized and excited. You had helped me to see what was invisible to me (and everyone else around)….even though I was the local “lean expert”.

The approach was classic “Mark”, and I have to admit I’ve stolen it and used it as my own many times, although not nearly as effortlessly. At your insistence, we entered through the outbound dock door, as you pointed out, “closest to the customer”. As I started to walk through and into the warehouse proper, you stopped at the door, and made me stop and describe what I was seeing.

The “Five Why’s” were relentless, and I think it was something like 30-40 minutes before we even moved off that spot, but the seeds were planted right then and there. I had now started to see the whole warehouse as “waste” and totally unnecessary if we could only get product flowing at takt. I can’t tell you how many times I’ve relied on the lessons learned that night to guide me when I get in the middle of something unfamiliar to me.

Well, it took us a couple of years, but your invaluable and patient counsel over the next few years shaped a whole organization’s culture. I know better (now) than to suggest “we’ve arrived”, but the principle of using “flow at takt” and making waste visible to drive continuous improvement is firmly rooted in our DNA now.

Aside from the impressive performance statistics of the operation I know you’ll appreciate more that the things you taught me have been dutifully passed along from me to the manager of the area, and through him, to his successor, and now through the college to many more. All we have to do now is close the loop and get you to hire one of the RIT students somewhere!

I’ll not pretend that a couple of hours on a Friday night several years ago was all it took, and I’m forever indebted to the many hours you spent with me afterwards helping me to grow, but it was truly a life changing event, and I thought you’d appreciate seeing a snippet of what it’s led to. Thanks again for all your insight and support in our, and my, journey.

If you ever find your way back East, you have to stop in to see it, drinks are on me. It is pretty wild, but if you do, I might tiptoe carefully around the idea that you’re the guy that taught me to “physically constrain the process to force it to flow at takt”. It was an essential part of our journey, but obviously anyone that would suggest we can change a 2,000,000 square foot warehouse into an 85,000 square foot crossdock can’t be seeing the world the right way! (Of course I have to follow that up with one of my favorite quotes one of the VP’s here used….”If it wasn’t for the fact we already did it, we would have said it’s impossible”. Thanks again.
This is the email he is talking about:

Dave and Tony, thanks again for giving the walk through to my 25 advanced lean class students yesterday. Some observations:

I think the floor was about the cleanest I have ever seen it. It is always clean, but yesterday seemed even more so.

The evidence of continuous improvement is amazing. Yesterday I saw a number of things that I did not see in my last visit Feb 10 – new lane structures, hybrid cards, changes in box 2, clearer e-box sheets, new standard work sheets and visuals, etc.

I really appreciate you taking to heart the input I gave you based on the feedback from my last class on the tour structure/agenda itself. The last tour was very good, this one was awesome. The standard work sheet Dave showed me for the tour was great standard work – content, sequence, timing and outcomes were all vividly clear. I asked for more of a focus on the production control system and you delivered on that request. Dave, in your intro, you sounded like me teaching my class (maybe not a good thing?!?).

[…]I was pleased the students had more time to ask more questions. I keep preaching continuous improvement in class and you guys model it which helps give the message credibility in the minds of the students.

The other thing that struck me, which is not new but seemed different for some reason I can’t explain….. You are moving large volumes of freight, […] and the floor is just so calm. There is no panic, no arguing, no anxiety, just people following the processes, getting product from point A to point B, in a quiet, controlled, efficient way. I still remember when I brought the facilities class over last spring, and especially 2 of the folks with lots of work experience said “I never imagined that a warehouse type of environment could actually look like this.”

Your safety performance is stunning. I know the record when I was there was 534 days. Then we had 2 “old-age” repetitive motion injuries in 2 weeks, then you went 600 + days. Now you are at 200+ days. Absolutely remarkable in a tight space with fork lift trucks moving around. 3 OSHA reportables in 4 years, wow.

I clearly remember “that Friday night.” I think we were in there until 10:00 or later. Paul and I had a really good synergistic style, we reinforced each other, and it was an intense experience for whoever was on the receiving end. This was not the last time we took someone through this exercise.

To be sure, it was Earl and his team that did all of the heavy lifting. All Paul and I did was give him a sense of an ideal flow, and challenged them to discover, and overcome, the obstacles between the current state and that vision – one problem at a time, a couple every day.

TPS Failure Modes – Part 1

Following on from the buzz created by the last couple of posts, I would like to go back in time a bit.

In 2005 Steven Spear wrote a working paper called “Why General Motors Lost and Toyota Won.” A reader can clearly the see emerging themes that were developed into his book Chasing the Rabbit .

Spear talks about the leverage of “operationally outstanding” in changing the game, the capabilities he sees in “operationally outstanding” organizations, then “Failure Modes at Becoming Toyota Like.”

I would like to dwell a bit on these failure modes, and reflect a little on what they look like.

Failure Mode 1: Copy Lean Tools Without Making Work Self Diagnostic

So what does “self diagnostic” mean?

For something to be “self diagnostic” you need two pieces of information:

  • What is supposed to happen.
  • What actually happens.

Then you need some mechanism that compares the two and flags any difference between them. This sounds complicated, but in reality, it isn’t.

Let’s look at a common example: At the most basic level, this is the purpose of 5S.

5S as a Self Diagnostic Tool

In 5S, you first examine the process and seek to understand it. Then, applying your best understanding, you decide what is necessary to perform the process, and remove everything else. Applying your best understanding again, you seek to locate the items where they would be used if the process goes the way you expect it to.

You improve the self-diagnostic effect by marking where things go, so it immediately clear if something is missing, out of place, or excess.

Then you watch. As the process is carried out, your “best understanding” is going to be tested.

Can it be done with the things you believed are necessary? If something else is required, then you have an opportunity to improve your understanding. Get that item determine where it is used, and carry out the operation. But go a little deeper. Ask why you didn’t realize this was needed when you examined the process. Challenge your process of getting that initial understanding and you improve your own observation skills.

Is everything you believed is necessary actually used? If not, then you have another opportunity to improve your understanding. Is that item only used sometimes? When? Why? Is it for rework or exceptions? (see failure mode #2!) Why did you believe it was necessary when you did your initial observation?

Does something end up out of place? Is it routinely used in a place other than where you put it? This is valuable information if you now seek to understand how the process is different from what you expected.

Now think about the failure mode: What does fake-5S look like? What is 5S without this thinking applied?

How do you “do” 5S?

Look long and hard if you are trying to audit your way into compliance rather than using it as a diagnostic for your understanding of your process.

Though the jargon “self diagnostic” sounds academic, we have all talked about visual controls “distinguishing the normal from the abnormal” or other similar terms. It is nothing new. What makes this a failure mode is that people normally don’t think it is that important when Spear cites a mountain of evidence (and I agree) that this is critical to success. You can only solve the problems you can see.

Another Example: Takt Time

What is takt time? Before you whip out your calculators and show me the math, step back and ask the core question of “What it is” rather than “how to calculate it.” What is it?

Takt time is part of a specification for a process – it defines what should be happening. By setting takt time you are saying “IF our process can routinely cycle at this interval, then we can meet our customer’s demand. Takt time defines both part of a “defect free” outcome of your work cycle as well as a specification for process design.

Then you apply your very best knowledge of the process steps and sequence and set out a work cycle which you believe can be accomplished within the takt. It becomes self-diagnostic when you check, every time if the actual work cycle was the same as the intended work cycle. An easy way to check is to compare the actual time with the designed time.

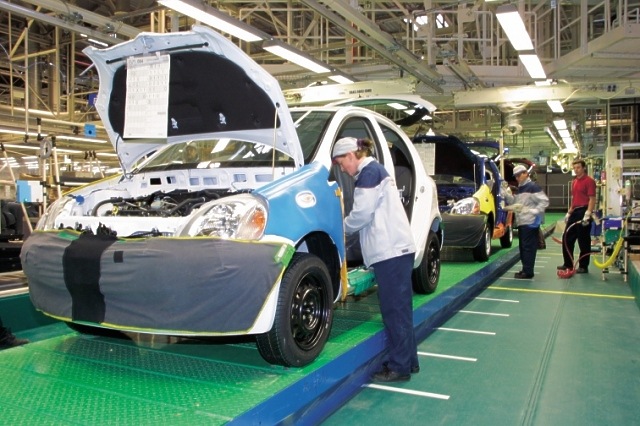
In Decoding the DNA of the Toyota Production System, Spear cites an example of seat installation.

At Toyota’s plants, […] it is instantly clear when they deviate from the specifications. Consider how workers at Toyota’s Georgetown, Kentucky, plant install the right-front seat into a Camry. The work is designed as a sequence of seven tasks, all of which are expected to be completed in 55 seconds as the car moves at a fixed speed through a worker’s zone. If the production worker finds himself doing task 6 (installing the rear seat-bolts) before task 4 (installing the front seat-bolts), then the job is actually being done differently than it was designed to be done, indicating that something must be wrong. Similarly, if after 40 seconds the worker is still on task 4, which should have been completed after 31 seconds, then something, too, is amiss. To make problem detection even simpler, the length of the floor for each work area is marked in tenths. So if the worker is passing the sixth of the ten floor marks (that is, if he is 33 seconds into the cycle) and is still on task 4, then he and his team leader know that he has fallen behind.

assembly-valencien-640

On this assembly line, time is used, not so much to pace the work, but as a diagnostic tool to call out instances when the work departs from what is intended – or in simpler terms, when there is a problem.

All of this has been about checking that the process is being carried out as expected. But, bluntly, the customer really doesn’t give a hoot about the process. The customer is interested in the output. How do you know that the output of your process is actually helping your customer?

To know that you first have to be really clear on a couple of things:

  • Who your customer actually is.
  • What value do you provide to that customer?

Put another way, can you establish a clear, unambiguous specification of what a defect free outcome is for each supplier-customer interface in your process? Can you follow that trap line of supplier-customer interfaces down to the process of delivering value to your paying customers?

To make this self-diagnostic, though, you have to not only specify (what should be happening), you have to check (what is actually happening), and you have to do it every time.

So poka-yoke (mistake proofing) is a way to verify process steps. Other mistake proofing will detect problems with the outputs. All are (or should be) designed to diagnose any problems and immediately halt the process or, at the very least, alert someone.

The theme that is emerging here is the concept of PLAN-DO and CHECK, with the CHECK being thoroughly integrated into the process itself, rather than a separate function. (Not that it can’t be, but it is better if CHECK is continuous.)

The Supply Chain

I was walking through the shop one afternoon and spotted an open bundle of steel tube – about half of them remaining. They used kanban to trigger re-order. The rule of kanban is that the kanban card is pulled and placed in the post when the first part is consumed. To make this clear, they literally attached the kanban to the bands with a cable tie. Thus, breaking the band would literally release the kanban. Simple, effective.

But, though this bundle had been opened, there was the kanban card still attached to the (now broken) banding. It was lurking at the base of the pallet, but visible.

I went and got the supervisor, and told him that “You are going to have a shortage of 4×5 tube on Wednesday, and it is your fault. Would you like to know why?” I guess I should point out that I had a pretty good relationship with this guy, so he knew I was playing him a little. Then I just said “Look, and tell me what you see.”

It took a few seconds, but he saw the kanban, said “Argh” and started to pick it up to put into the post. I stopped him and asked if it was his responsibility to do that. No, it was the welder’s responsibility. “Then you should take a minute with him, and do what I just did with you.”

Then I asked him how often the kanban cards were collected. (I knew, I wanted to check that he knew.) “Daily, about 1 pm.”

“How often do you walk by here every day?” He said at least twice, in the morning and right after lunch. “So all you need to do is take a quick glance as you walk by, twice a day, and you will always get that kanban into the post before 1pm.”

He did, and their periodic shortages dropped pretty much to zero.

Why?

First, the system was set up JIT. We knew the expected rate of use of that part. We knew the supplier’s lead time and delivery frequency. We knew the bundle size. MATH told us the minimum number of kanban cards that would need to circulate in this loop to ensure the weld cell never ran out… unless one of the inputs was wrong or unless the process operated differently than we expected.

We also knew that, given the rate of consumption, how many bundles should be in the shop at any given time, and we had space market out for just that amount. Thus, we could tell immediately if something was received early, or if our rate of consumption fluctuated downward. (Because a pallet would arrive, but there would be no place to put it.)

We could have just had a Team Member come by once a day and check if a bundle had been opened, and send an order to replenish it. We could have been even more sophisticated and just set up a barcode scan that would trigger a computer order.

But if we had set up the process that way, how could the Supervisor distinguish between “Ordered” or “Not Ordered?” It was that stray out-of-place kanban card that told him.

Bin with kanban cardThus, physical kanban cards, physically attached to the materials, represent a self-diagnostic check. If the card is there, then that container should be full. Quick to check. If the container is not full, there should be no card. Quick to check. If a container arrives with no card, it was not properly ordered and is likely excess (or at least calls for investigation). Quick to check. The physical card, the seeming crude manual operation, provides cross-checks…self-diagnosis… simply and cheaply in ways that few automated systems replicate.

So far these have all been manufacturing examples. But Spear is clear that all work is self-diagnostic, not just manufacturing.

What non-manufacturing work fits into this model?

(Hint: All of it.)

What about a project plan? Though in reality, most project plans don’t. Read Critical Chain by Goldratt to understand the difference – and produce and manage project plans that are much more likely to finish on time.

What about a sales plan? Do you predict your monthly sales? Do you check to see if week 1 actual sales deviated from what was expected? Do you plan on activities that you believe will hit your sales targets? Which customers are you calling on? What do you predict they will do? (Which tests how well you really know them.) Do you actually call on those customers? Do they need what you thought they would? Or do you learn something else about them? (Or do you make a best guess “forecast” and wait for the phone to ring?)

Once you have a sales plan, do you put together a manufacturing and operations plan which you believe will match production to sales? How much variation do you expect to accumulate between production and sales over the course of that plan? Do you put alarm thresholds on your finished goods or your backlog levels that would tell you when that predicted variation has been exceeded?

How do you (and how often do you) compare actual sales (volume, models, and revenue) against the plan? Do you know right away if you are off plan? How long will you tolerate being off plan before you decide that something unexpected is happening? Is there a hard trigger point already set out for that? Or do you let the pain accumulate for a while?

A lot of companies were caught totally by surprise a few months ago when their sales seemed to fall off a cliff. Question: Did you have rising inventory levels before that? Was there a threshold that forced attention to something unexpected? Or did you increasingly tolerate and normalize deviance from your intended business plan?

At the next levels up – you have a business plan of some kind. You have financial targets. Do you have specific actions you plan to take at specific times? Do you check if those actions were actually taken? Do those actions have some kind of predicted outcome associated with them? Do you check if the actual outcome matches what you predicted? If you just “try something to see what happens” you might learn, but you might not. If you predict, then try to see IF it happens, you are more likely to gain more understanding from that experience.

When you design a product, do you have performance specifications? Do you test your design(s) against those performance specifications? Do you do that at every stage, or just at the end?

When you say “We need training” have you first specified what the work process is? Have you studied the situation and determined that people do not have the skills or knowledge to do the job? Have you specified what those skills are?

Have you developed the training to specifically develop those skills? Do you have a way to verify that people got the skills required? Do you check if, now, they can perform the work that they could not perform before? If you didn’t do the last, why did you “train” them at all? How do you know it was not just entertainment?

“Management Is Prediction”

deming

This quote, attributed to W. Edwards Deming, really sums up what this is about. By specifying an outcome – “defect free” (which implies you know that is), within a certain time; and by specifying the process steps; you are predicting the outcome.

“If we do these things, in this sequence, it should require this amount of time, and produce this result.”

Then do it, and check:

Does what you really had to do reflect the tasks you thought would be required?

Does the order you really did them in reflect what was in the plan?

Does the time required reflect the time you planned on?

Did it produce the intended result?

Building those checks into the process itself makes it self-diagnostic.

Try This

Go study a process, any process. Just watch. Constantly ask yourself:

How does this person know what to do?

How does this person know if s/he is doing it right?

What alerts this person if s/he makes a mistake?

How does this person know s/he succeeded?

If there are clear, unambiguous answers right in front of you – without research, without requiring vigilance or luck on the part of the Team Member, then you probably have something approaching self-diagnostic work. Likely, you don’t. If that is the case, don’t say you are “doing lean.” You are only going through the motions.

Really Long Takt Times

One question I see coming up a lot in various forums is how to deal with issues unique to very long takt times. By “very long” I usually hear about many hours, sometimes days, occasionally weeks. Because it comes up fairly often, I thought I would take a shot at addressing it here.

I think the biggest hurdle for people to get over is the issues are largely the same as shorter takt times. They are just harder to see because the work starts to lose a human time scale. The trick is to get it back onto a time scale that people can relate to.

By this I mean that a person, generally, loses a sense of how long something is taking once it goes beyond a dozen minutes or so. In contrast, the stereotypical automobile line has a takt of about 60 seconds. Once an auto assembly worker loses 3 or 4 seconds of time, there is really no way she will be able to complete the programmed work cycle without help or stopping the line for at least a few seconds.

As work cycles get longer, though, the work remaining until “done” gets more and more disassociated from “now” and the idea of the necessity to maintain a particular work pace becomes abstract. This is less of a technical issue than one of human psychology. People, in general. tend to believe they can finish something in time long after that is no longer true. (Ask any college freshman working on a term paper.)

The countermeasure is the same as a manager would apply to any long project: milestones.

When the takt times are relatively short, the “milestones” are the takt intervals themselves. Each takt time signals a stage of work that must be complete. If this is not true, the line will (should) be stopped at that point. (Remember – “Never pass along a defect” and this includes incomplete work.) The problem will be corrected, and the cause understood. Oh – actually this is not quite true. A Toyota assembly line has the work zone divided into 10 sub-intervals, and the worker has a good idea what work should be completed at what point.

However, since most of us are likely just beginning – If your takt time is longer than a couple of dozen minutes, then, define the work in stages. In one operation I suggested the following:

Take about 85% of your long takt time, and divide that into quarters. Define what job should normally be complete by the time each of those check points comes up. As an example – if the takt time was 100 minutes, then determine the expected work completion at 20, 45, 65 and 85 minutes. Give the Team Member a way to know where he is at that point vs. the expectation, and a way to call for help if he is off by even a little bit. He should also call for help before that point if he is disrupted by something that he knows will cause a delay.

This is just a starting point to start to stabilize the system and build your support structure. If you reach the point where things are running smoothly at this level of granularity, then cut those time intervals in half.

At each point you will find more problems. The problems are likely to be smaller, but there will be more of them. All of those problems are sources of friction, and therefore wasted motion and time, on your system.

BUT – before you start down this road, have a few things in place first.

  • Establish credibility for the concept that you are genuinely doing this to see problems that are making the worker’s jobs difficult. If you use it, just once, to initiate a negative consequence for “not working fast enough” then forget it.
  • Actually work the problems. This means work them to eliminate the causes. Put in a process for managing the problems, make it visible so that the people working can see you are working on them. Again, this is to maintain credibility. If problems get recorded and sunk into a black hole (like a database in a computer somewhere), then you are not assuring the people on the line that you actually care.
  • Build your immediate responses (escalation) system. This mean team leaders (first responders) who can, and do, respond to help calls quickly. The only thing worse than having no way to call for help is to call and have no one respond. Again, the system loses credibility after about the third andon pull with no response.
  • Don’t worry too much about every detail within the work interval. The important thing, at first is to make sure that the same things get done within that interval. Detailed sequence standardization will come in time.

Summary: The key to managing really long takt times is to break the work into time-based intervals, and manage to those, rather than the entire work cycle itself.

Shingijutsu Kaizen Seminar – Day 3

Yesterday I told you the plan for today. Here is what really happened.

We got the even pitch going for a while. I was at the front of the line releasing units down the line as the pre-build Team Member was done with them. I was watching distance (since distance = time on a moving line). As the previous unit hit the pitch first pitch line, I launched the next. One of the little discoveries was that the conveyor has a “slow spot” that really changes the speed. Oh – and that happens to be when we measured the speed yesterday. Net result? The units were actually fired down line about 10% faster than they should have been. Oops.

Next discovery? Nobody noticed. So much for this great labor bottleneck. There were line stops, but they had nothing to do with this.

In the first position, our experiment to actually present parts at the point of use cut the team members’ work cycle. How much depends on the situation. His work cycle previously varied all over the place – easily by 100% or more when he had to go look for parts and wasn’t sure where they were.

By simply stabilizing his work, we cut his cycle time to well under the takt.

We ended up not recording line stops, but on the other hand, there weren’t any actual andon calls today. That is both good news – nothing we did really disrupted things – and bad news – their system has serious issues, and none of them trigger andon calls.

The kaizen team members studying the semi-automated test operation designed and proved a work sequence that not only handled this bottleneck process, they cut it nearly in half. It can be done well under the takt time if the Team Member and supervisor don’t panic and try to work ahead. If they do, it disrupts everything for two or three units. To “pay” for this improvement, the kaizen team members shifted a (very) small amount of work to the next position down line. All he has to do is disconnect the test equipment. That gives our team member of focus the time to start the next unit right away. Disconnection takes only a few seconds, and easily fits into the work cycle of this team member.

Another sub-team worked on the sub-assembly process with similar results to the first team. By actually making sure all of the parts are present and presented well, the terrifically unstable cycle started to get consistent. There is a lot of work here, and honestly I think the best solution is to break up the sub-assembly cell and get these processes operating right next to the assembly line. There are huge advantages in information flow (they could just look upline by two units and see what they needed to start next). There are huge advantages in material conveyance – there isn’t any. Quality issues would be spotted immediately and could be addressed immediately. Lots of other advantages as well.

This evening we worked on the final report-out. Since this is a Shingijutsu event, there is a fairly rigid pattern for how these report-outs should go. The team spent until about 10:30 working on it and having it reviewed by sensei. I think we got off pretty clean in that department since I already knew the drill, coached the team on what was important plus sensei knows me from past events. I have seen draft report-outs thrown across the room in the past – not especially effective communication in the details, but the big picture, “this is not acceptable,” gets across fairly clearly. That didn’t happen this time. I think Shingijutsu as a company, is mellowing out a little. It is too hard to actually say, but time will tell.