Many years ago I wrote an article for SME called The Essence of Jidoka. In that article I described a four step process designed to improve productivity and drive continuous improvement. Since then these four steps have been picked up and incorporated into the training materials of many consultants, used to write the Wikipedia article on jidoka (which I most assuredly did not author), and even found their way into some academic papers. Sometimes with attribution back to my article, may times without.
In that article, “jidoka” was described as a four step process:
Detect a problem.
Stop.
Fix or correct the problem.
Find the root cause and implement a permanent countermeasure.
But I would like to take a hard look at the first step: Detect the problem. This is where, I believe, most organizations actually fall down. And in doing so, they also fall down on respect for people.
The key question is: “What do you consider a problem?”
Most organizations do not see a problem until the symptoms are bad enough that they are compelled to do something about it. This means people have been struggling with issues for some time already. The machine isn’t reliably producing good parts. Or someone is having to rework material. Or the supplies cabinet is always short, and the nurses have to launch a safari to find what they need.
Contrast this with a company like Toyota. Every Toyota-trained leader I have ever dealt with is very consistent. A problem is any deviation from the standard. More importantly, a deviation from the standard (1) forces people to improvise and (2) is an opportunity to learn.
Spear’s research concluded there were four tacit rules for how activities, information connections, flow paths, and improvements were designed and executed in Toyota operations. Each of those rules describes:
Any deviation from the standard triggers some kind of alert that gets someone’s attention. And whose attention is explicitly defined – That is a standard as well.
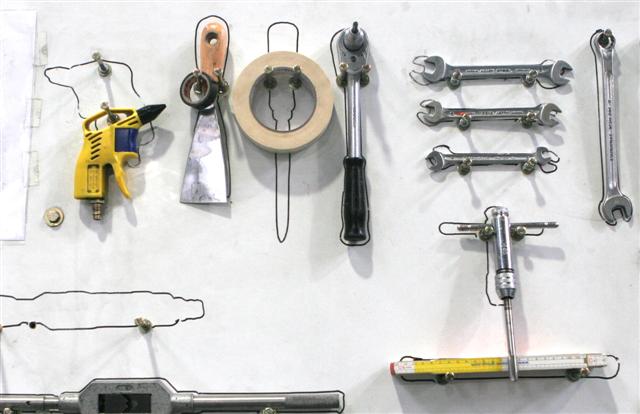
As I look at a work area, I often see a lot of 5S type of activity. Things and their intended locations are marked and labeled. These are standards. They establish what should be where. But the question to ask is “What happens if something is out of place?”
That is a deviation from the standard. It is a problem.
Stop
Fix or Correct (put it back – restore the standard condition)
Investigate the root cause
“What’s going on with the air wrench today?”
“Actually it is an extra one.”
“Really? Where did it come from?”
“I borrowed it from the Team Member in work zone 3.”
“Ah, OK. Why did you need his?”
“The regular one isn’t working.”
“Hey – thanks for letting me know. I’ll get it to maintenance.”
“Thanks”
“Did you tell anyone about the problem before now?”
“No, I just borrowed the wrench. I just needed to get this job done, then forgot. It’s no big deal, it’s easier to just borrow Scott’s wrench.”
And in that exchange, what have you discovered about your daily management system by simply being curious about a trivial deviation from a 5S standard?
Is this the Team Member’s fault?
Probably not. What is your standard? What is he supposed to do if the wrench stops working? Is there an escalation process and a response for this kind of small stoppage? Or are your Team Members just expected to find a way to work through the issue? Which of those responses is more respectful of the Team Member who spends her time trying to create value for you?
Often times there is no standard.
But without a standard you have no way to tell if there is a problem (other than a feeling that something isn’t right). And if you are sure there is a problem, without a standard you can’t really define what “fixed” is.
So start with defining the standard. First, go back to Decoding the DNA of the Toyota Production System. You can get an idea of the kinds of things you should standardize.
As you think of standards, consider a standard for your standard:
Express it from the viewpoint of the process customer.
Define it in a way that can be verified as “met” or “not met.” No gray zones. You can quantify the magnitude of a problem, but not whether you have one.
There is a visual or other control tells the appropriate person, right away, if there is a deviation from your standard?
Is there a standard that triggers a response to clear the problem?
5S is nothing more than the first step of setting standards. Many people say to start there, but don’t say why. The point is to practice setting standards and holding them. Taiichi Ohno is quoted as saying:
“If there is no standard, there can be no kaizen.”
Any deviation from the standard is a problem.
Your choice, as a leader, is how to handle that problem.
Jeff Kaas talks about Leader Standard Work https://kaastailored.com/blog/what-is-leader-standard-work/
The people at Kaas Tailored in Mukilteo, Washington are friends, neighbors, and colleagues of mine. They have been a tour stop for people from all over the planet who want to learn more about their people-centric culture of continuous improvement.
Last year when the tsunami of COVID washed over all of us, their business faced an existential threat and they made a dramatic pivot to making medical PPE – masks and face shields. Their main motivation was “This is what our community needs right now.” In fact, you might have seen a bit of their story as part of the PBS Frontline Coronavirus Pandemic episode.
Dramatic change reveals obstacles that may have been buried under the Old Normal, and this was certainly the case for Jeff Kaas and his team. The awesome part is that they doubled down on their effort to learn and practice Toyota Kata as a response. They needed better organizational alignment, tying their organization’s philosophy and direction down to their day-to-day processes, and they used Toyota Kata to do that. I think they are emerging as a stronger organization as a result.
I mentioned in the opening that they have been a tour stop for many years. To further that end, they have worked hard to make that experience available online. What is cool about it is now it isn’t necessary to travel to Mukilteo, Washington (about 20 miles north of Seattle) to see them. They can come to you.
So when they asked me if I would like to participate with them in a series of online events they will be presenting starting on March 24, 2021 my response was an immediate Yes. To be clear, my role is chiming in with color commentary, and perhaps being a little more in front when they start talking about Toyota Kata.
If you would like to participate, here is their registration page:
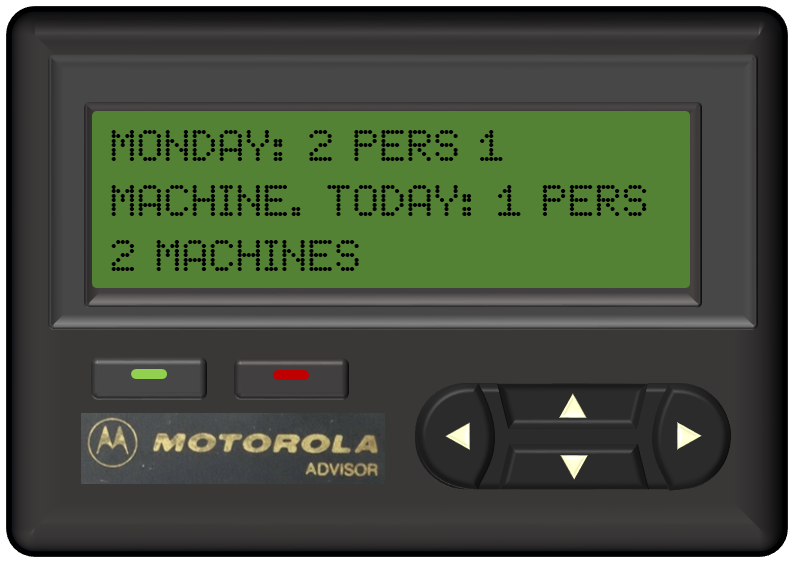
MONDAY: 2 PERS 1 MACHINE. TODAY: 1 PERSON 2 MACHINES
On a Thursday afternoon in the summer of 1997 I sent that pager message (remember pagers?) to Rick from the factory where I had spent a week working with Mr. Shimura of Shingijutsu and Reiko, his interpreter.
I knew that Rick would be wrapping up a class teaching the basics of kaizen events to a group of suppliers and if I were lucky, he would see the pager message and use it as a reinforcement to the participants. Rick and I usually alternated teaching that class, sometimes we taught it together. We were good work partners, finishing each others’ sentences and the mutual respect was very high.
I was on-site at another supplier. We were there to help them take some first steps toward “lean production.” Our goal, at least the idea, was that we would work through the process of making significant improvements with the thought that they would learn enough to try it themselves.
This was not my first visit – the episode with Mr. Iwata that I relate in my third post to this blog had happened there a couple of months earlier, and that visit had resulted in my company offering up Mr. Shimura’s time on our dime.
This may well have been “an offer they couldn’t refuse” and I’m not sure everyone there saw it as help. We were from their 800 pound gorilla customer, they had trouble making on-time deliveries, and sometimes that isn’t the kind of help that you want. From their perspective their biggest customer had people who knew their way around a factory spending days on their shop floor and, most certainly, ascertaining how much more productivity was possible if only, well, the buyers squeezed them hard enough. It didn’t really work that way, but it had worked that way in the past, so who could blame the suppliers for thinking this was a more sophisticated way to audit them?
Anyway, we had worked through the week to carefully look at the tasks involved to unload, load, and machine a single part on a large linear milling machine. Mr. Shimura was there asking questions, not so much from curiosity but to direct my eyes. I’m sure he already knew the answers. As we dug into the timing, it became clear that there was enough operator waiting time as the part was being milled that a single operator could, theoretically, unload and load an adjacent machine – operating two of them at once.
So we carefully worked out the chorography required to make it work, and on Thursday mid-day it all came together. The work was flowing, the parts were flowing. It was really a thing of beauty.
Friday morning we would report out the week to management, and Friday afternoon I would head to the airport to go home to Seattle.
But I had some worries as well. Although the company President, and the VP of Operations were supportive, their support was along the lines of welcoming everyone into the plant, making it clear they were happy to see us, attending the final report-out and endorsing our efforts.
I was still pretty knew at this. I was making the transition from teaching classes and running simulations to making real change in real factories (that weren’t mine!). I was really fortunate to have a lot of 1:1 time with Mr. Shimura and Reiko. I asked questions, he patiently taught me how to use the standard work combination sheet, and other nuances of kaizen and flow production. I got a lot more out of that week than the supplier did simply because I was there spending time with Mr. Shimura and taking advantage of every second I could. I had 1:1 time because none of the supplier’s managers were seeking him out to learn from his vast experience.
Some quotes I will never forget: “If I see something is hand written, then I know at least one person has read it.”
“If parts that are in tolerance don’t fit, it is a problem with the tolerances.”
(Walking through the shop) “Does this company lose a lot of money?” Reply: “No, they are very profitable.” “Then their prices are too high.”
In the end, though, I am equally certain that come Monday morning the work sequence we had so carefully worked out – at great expense to my company for my time, my travel, Mr. Shimura, his interpreter, and others – was never repeated again.
Why not?
Well, we can all blame “management commitment” because that is really easy to do. But I put equal weight on our paradigm of improvement at the time. The idea that, in 4 working days we could institute a change that flew straight against the operational and cultural norms of the company and expect it to last any longer than until we were out the door was, well, ludicrous.
Why should we expect anything different?
It is ludicrous in any company, whether this work is being brought in from outside or internally generated.
The people who have to manage the daily work, whether they were involved in this exercise or not, have no paradigm for dealing with the myriad of issues that are bound to be surfaced after we pulled all of the buffers out of the material and the time. Yes, it can work, IF we understand the conditions required for success, and IF we pick up right away when those conditions aren’t there and IF we respond to fix it very fast. Then, yes, it can work.
It will be more time and trouble than it was before, though, unless the next things are also done.
For at least some of those issues – maybe not all of them, but always working against a couple of them – seeking out why those issues happened and dealing with the causes.
Just to keep this tiny two-machine “work cell” operating in this large factory would have eventually engaged every support system they had.
That’s the whole point, actually, of a model line. It isn’t building the model line. It is what you have to fix in your systems to keep it going.
Many years later I spent a week on another company’s shop floor with their internal kaizen team and getting an andon / escalation process up and running was the only thing we were working on that week. That process is just as important, if not more, than the baseline work of flow. Because without it, your flow will fall apart.
This is the part of the process that engages people. Putting in the baseline process is the easy part. Fielding the problems that flow surfaces – that takes changing the day-to-day routine in the workplace, and is a lot harder. That is where the culture change comes into play. Actually it is more than engaging people. It engages specific people: This is the part that must engage the leaders. They must lead, guide and coach process of working through all of the issues so stability can be reestablished. Then challenge the team to get to the next level.
But all of that is what I know now. I had the knowledge back then, but not the deep understanding.
So – I am thankful for that week because my understanding of what I had been teaching for months easily doubled… twice in those few days.
I was back there a few more times, they even gave me a badge (which I still have somewhere) so I could let myself in. One time I spent two straight weeks there. They were good people.
But we were applying work to the technical systems, and never really dealing with their default responses to problems, their culture, the way they went managing their daily work.
I know so much more today it is actually humbling to write this. And I still have a lot to learn. We all do.
The company I was working in? They were sold, and sold again. I think they are still in business, but I wouldn’t know anyone there.
Sometimes the situation arises where the learner has been beating her head against an obstacle with little or no luck overcoming it. The question comes up: When is it OK to give up and switch to something else.
The answer is, of course, a little situational. (Consultant speak: It depends…)
The natural progression of the Improvement Kata will provide an opportunity.
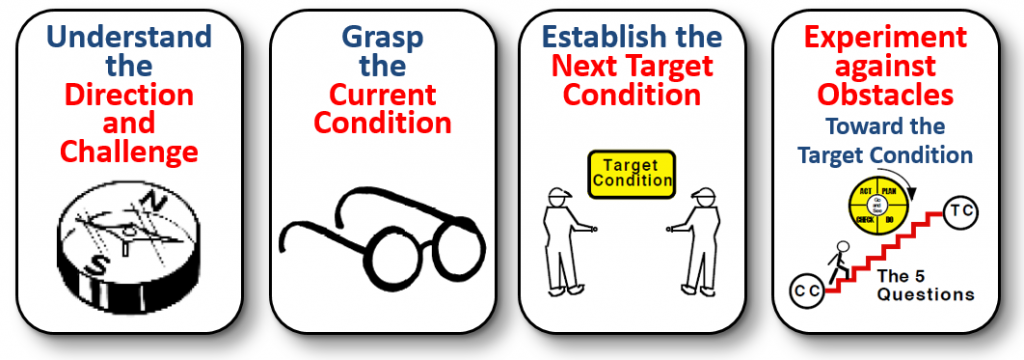
Improvement Kata steps by Mike Rother
As the learner is iterating against obstacles toward the Target Condition the clock is ticking because the Target Condition is always associated with an “achieve by” date. If the Target Condition is achieved OR we hit the “achieve by” date without achieving it, the learner should cycle back to the beginning and:
Verify understand of the direction and challenge. (The learner may well have gotten more clarity along the way.)
Get a complete grasp of the Current Condition. This is important because often while working toward a Target Condition the learner is only updating specific process and performance metrics, and may not be looking for collateral changes elsewhere. This is a time to take a step back, put up the periscope, and get a grasp of the complete picture.
Based on that new Current Condition, establish a new Target Condition, with a new “achieve by” date.
Now… identify the obstacles in the way of achieving that new Target Condition. Ideally they should wipe the obstacle parking lot clean and take a fresh look.
This process often helps clear the learner’s mind and see another way to get there, or see easier obstacles that were overlooked before.
This is also why it is important for the “achieve by” date to be relatively close (a couple of weeks) – because that date is a safety valve that forces a reset of the process if the learner is stuck.
If the learner asks if it is OK to work on a different obstacle, then the coach should become curious about the learner’s rationale.
Specifically, I want to understand why the learner thinks there might be an easier way vs. just saying this one is too hard. This may well require some more information gathering – a mini version of the reset I talked about above.
The key point here is to maintain the learner’s motivation. There is a fine line between struggling to solve a problem and getting frustrated. This might be a good time for the coach to engage in some empathetic questioning.
For example, name the feeling you are picking up to test your hypothesis: “It seems you are really frustrated by this…” Then listen. The learner will likely either agree, “yeah, I am.” or refute and give you more information, “No, I’m just trying to…” Then you might learn more about their threshold of knowledge with the process of problem solving.
That can open up a discussion for why the learner thinks it would be a good idea to try something else. Then use your judgement.
But as a coach, I don’t want to make switching obstacles too easy because there is a high risk of it becoming a whack-a-mole game. Some obstacles actually require digging and perseverance to overcome. Your job, coach, is to keep the learner in the game.
Sometimes, though, the learner gets fixated on a problem and doesn’t see another way. Even in this case, if the time to the “achieve by” date is short, I’d let it ride. But if that isn’t practical…
The coach may well have a broader perspective – in fact, this is part of the coach’s job.
If the learner is making progress on something I (the coach) consider a red herring, I generally let it go. There is always learning involved – so long as the effort doesn’t bog down progress.
Sometimes, though, the learner is getting frustrated and so focused that he just doesn’t see any other way.
This is time for gentle intervention with whatever questions might help the learner pause, step back, and see the bigger picture.
For example, perhaps something like “If this obstacle were cleared, how would the process operate?” This might not be the full target condition. I’m just trying to learn what “solved” looks like to the learner. Maybe just thinking about it will help them see the where they are trying to go and possibly another path to get there.
An interesting follow-up might be, “Hmmm, what’s stopping it from working that way now?”
“What would you need to learn to better understand what is going on?” might be another avenue to get the learner to look at his threshold of knowledge vs. the big ugly obstacle in front of him
It all depends on what you think will help the learner raise her head and take a different look at things.
But in the end, if you have a learner that is truly stuck, and after a few tries isn’t going to get unstuck, then, honestly, it’s time to go shoulder-to-shoulder with them and dig into things together.
What I would work very hard to avoid is direct intervention – “Why don’t you work on…” because this undermines the entire process by giving them the answers and can easily create a “what do you think I should work on?” expectation next time.
In Western business it is pretty typical for someone to be assigned to come up with a proposed solution to a problem, and then seek approval for that solution. In some companies that consider themselves more forward thinking, they might even say something like “bring me an A3.”
As a result I have seen a number of organizations that produce some kind of guideline for “how to fill out and A3.” They teach “problem solving” courses so people can learn to do this properly. I have developed, and delivered, a couple of those back when I was working in internal continuous improvement offices. We had case studies, exercises, all in an effort to teach people to be better problem solvers.
Similarly, a (very) long time ago, I recall an exchange on an online “lean” forum where someone had asked about Toyota’s “problem solving class.” The thought was that because Toyota has good problem solvers, that their course must be really good.
My response was that I have a copy of Toyota teaching materials for a problem solving course. It is good, but nothing magical. Because that isn’t how Toyota develops good problem solvers.
They do it with coaching.
What makes the “A3” process work isn’t the A3, or even the structure. It isn’t the instructions, guidelines, or the quality of the problem solving classes.
It is the almost continuous interaction between the problem solver and the coach.
The problem solver’s thinking is challenged. “What evidence do you have?” “Have you tested that assumption?” “How is that happening?” “Why do you think that is the problem?” “What are you planning for your next step?” “What do you expect to learn?”
And it is the coach’s stubborn refusal to give the problem solver the answer. Rather, they insist on following the rigor of the problem solving process using scientific thinking.*
The process is an application of the principle of “Challenge” followed by support to enable the problem solver / learner to meet the challenge. They have to bring perseverance to to the table, but the coach is there to make sure they actually learn to be better problem solvers in the process.
Likely (if you are reading this) you already know that. We knew that when we worked so hard to make those A3 guidelines and problem solving courses. But we did those things anyway.
Why? Because it is easier to develop and deliver those general class materials than it is to develop managers into coaches and leaders.
But the fact remains:
If you want to develop better problem solvers, what you need are better coaches.
The implications here are really profound for most organizations.
If you assign someone to solve a problem, to “do an A3” (or whatever structure you use), you are obligating yourself to coach them through the process.
This is far more than getting status updates. And it is far more work. Because you are teaching, not just supervising. If they fail, it’s on you, not them. “If the student hasn’t learned, the teacher hasn’t taught.”
In Toyota Kata world we have reduced those questions down to the critical few in the Coaching Kata. That, of course, is a start. Your job as a leader is to practice until the flow of the logic is second nature to you, until you can go beyond the script. Until your first-nature, reflexive response to anyone proposing to do something is “What problem are you trying to solve?” or “What are you trying to learn?” and then carefully listening to their logic and pushing them to the edge of their ability with the next step.
When you can take your own coaching training wheels off, you can then (and only then) ask someone else to ride a bicycle for you, because you will know how to teach them to ride – and that involves more than sending them to a PowerPoint lecture on “Riding a Bicycle.”
“Because knowledge is not understanding” – Destin Sandlin.
———
*Some years ago I worked briefly with a manager who had been one of the key players in Toyota’s initial startup of their plant in Kentucky (TMMK). He told me an interesting story. In the beginning, he noted, the U.S. managers would go to their coordinators (Japanese Toyota senior leaders there to advise the new team) and ask for advice.
Then one week all of the U.S. team went through the problem solving / A3 course. The following Monday, he went to his coordinator with a question, and the response was “Doug-san, where is your A3?” After that day, the coordinators would not engage unless there was an A3 that outlined, in writing, what the manager already understood about the problem, what he was seeking to learn, and how he proposed to go about learning it.
Think about that story vs. sending people to “problem solving class” or even a “Toyota Kata” class. When they return, do you insist that they apply what they have learned whenever it is appropriate from that day forward? If you don’t then you are wasting their time and your money sending them to that class. They will never develop the skill without practice, and it is always easier not to practice something we are not comfortable doing.
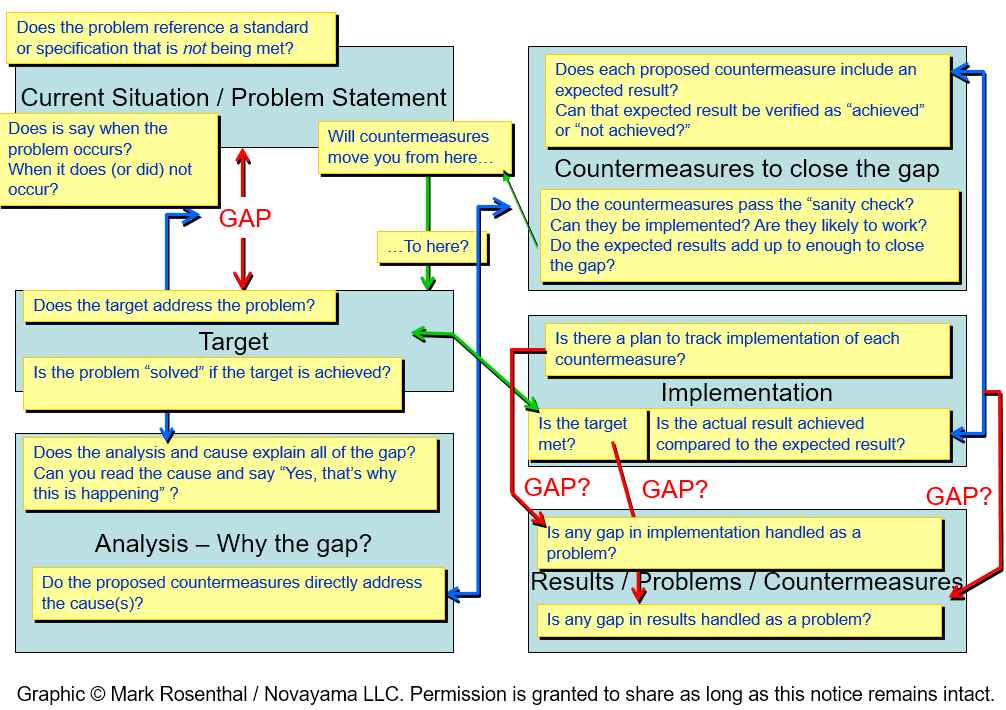
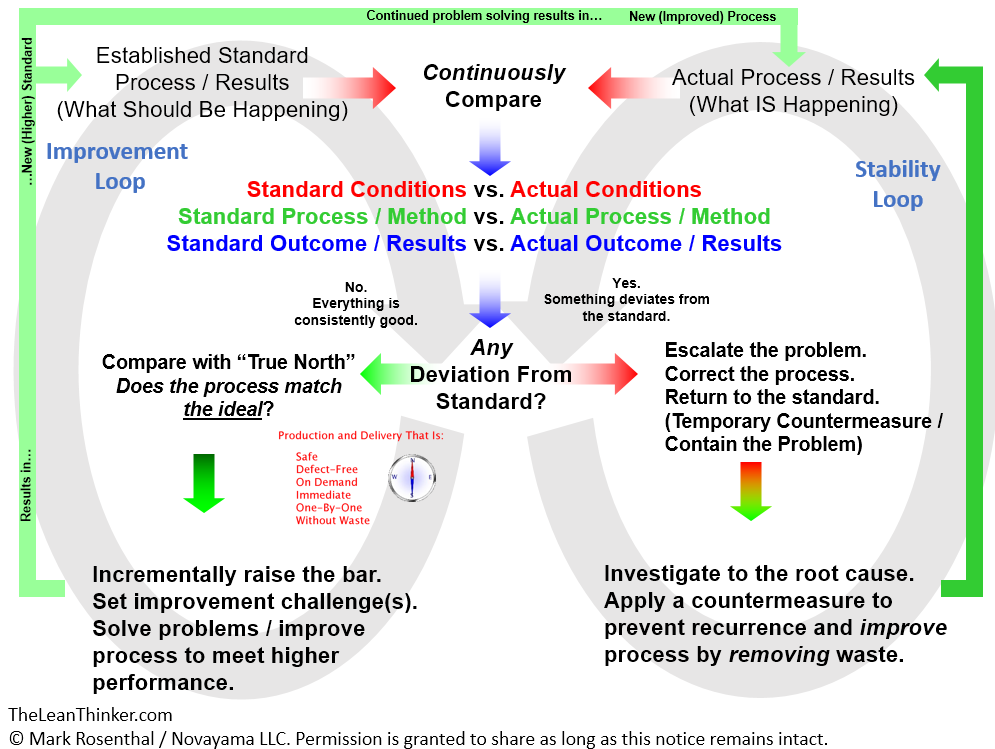
I’m digging through old archives again, and came across this graphic I put together around 2006 or so. It depicts more detailed version of “Organize, Standardize, Stabilize, Optimize” showing the continuous comparison between “what should be happening” and “what is actually happening.” It is the gap between these two that drives improvement forward.
Like the pocket card in the last post, this is built on a foundation established by the work of Steven Spear, especially his PhD dissertation that is summarized in Decoding the DNA of the Toyota Production System. By the way, if you are in the business of continuous improvement, reading (and understanding) this breakthrough work is critical for you.
Other than generally sharing this, my other reason for putting this up is that in the Toyota Kata community there has been discussion for about a decade about whether or not the right hand loop – pushing for stability – is an appropriate use of the Improvement Kata.
I think that is an unfortunate result of some very early conversations about the difference between “troubleshooting” and “improving” a process. We get into semantic arguments about “problem solving” as somehow different from “root cause analysis” and how the Improvement Kata is somehow distinct, again, from those activities.
This makes no sense to me for a couple of reasons.
Scientific Thinking is the Foundation
Toyota Kata is not a problem solving tool. It is a teaching method for teaching scientific thinking, and it is a teaching method for learning to teach scientific thinking. In the books and most literature, it uses organizational processes as working examples for the “starter kata,” but exactly the same thinking structure works for such diverse things as working through quality issues, developing entirely new products and processes, working through leadership and people issues. The underlying sub-structures may change, but the basic steps are the same.
When I encounter an organization that already has a “standard problem solving approach” I do not attempt to tell them they are wrong or confuse them by introducing a different structure. Rather, I adapt the Improvement and Coaching Kata to align with their existing jargon and language, and help them learn to go deeper and more thoroughly into their existing process.
Stability is a Target Condition
I see a lot of pushback about working to “return a process to standard.” In reality, that is the bulk of the activity in day-to-day improvement. The whole point of having a standard in the first place is to be able to see when the actual process or result is somehow different.
Think about it: If there isn’t an active means of comparing “actual” vs. “standard” what is the point of having a standard in the first place?
Think of the standard as a target condtion.
What obstacles are preventing you from [operating to that standard]? You can guess, but the best way is to diligently try to operate to the target condition and see what gets in your way. That might not happen immediately. Maybe some time will go by, then BAM! You get a surprise.
This is good. You have learned. Something you didn’t expect has interfered with getting things done the way you wanted to. Time to dig in and learn what happened.
Maybe there was some condition that you could have detected earlier and gotten out in front of. Who knows?
You Cannot Meet a Challenge Without Working on Stability
As you are working to reach new level of performance – working toward a new challenge – there will be a point when the process works sometimes, so you know it is possible. But it doesn’t work every time because there are still intermittent obstacles that get in the way.
Nevertheless, you have to work diligently to see problems as they occur, respond to them, dig into causes (root cause analysis anyone?) and systematically protect your process from those issues.
The only real difference between covering this territory for the first time vs. trying to recover a previously stable process is that in the later case you can ask “What has changed?”
But, in the end, in both cases – stabilizing a new process vs. re-stabilizing an old one – you are dealing with conditions that are changing from one run to the next. That is why it works sometimes and not others. You don’t know what is changing. You are trying to figure it out by experimenting and learning.
What About Root Cause Analysis?
My challenge is still a stable process.
My current condition is my level of understanding of how the process works today, and the exact mechanism that results in a defect. Even defects are produced by a process – just not the process we want.
That understanding will be incomplete by definition – because if we truly understood what was going on we wouldn’t have the problem. So… what do I know (and can prove with evidence) and what do I not know.
What do I suspect? What evidence do I need to gather to rule out this possible cause, or keep it in play? Next experiment. What do I expect to learn?
I’ll write a more detailed post about this at some point. I think it is a topic worth digging into. Suffice it to say that I have absolutely used the Improvement Kata structure to coach people through finding the root cause of wicked quality problems.
It really helped that they were able to see the same underlying pattern that I had already been teaching them. It made things simpler.
Don’t Complicate a Simple Concept
It’s all “solving problems” (the term “problem solving” apparently has some specific form it needs to take for some people).
The underlying structure for all of it is scientific thinking. Some say it’s PDCA / PDSA. Same thing.
Splitting semantic hairs and saying “this is different” makes simple things complicated. Yes, there are advanced tools that you use when things get tough. But… addition and subtraction; basic algebra; advanced polynomials; basic differential calculus; advanced multivariate calculus – IT IS ALL MATH. You apply the math you must to model and solve the problem at hand.
DON’T apply more math than you need just because you can. That serves no purpose except, perhaps, to prove how smart you are… to nobody in particular.
Solving problems is the same. There are some cases where I need to develop a designed experiment to better understand the current condition – the interactions between variables. There are cases where other statistical tools are needed. Use them when you must, but not just because you can.
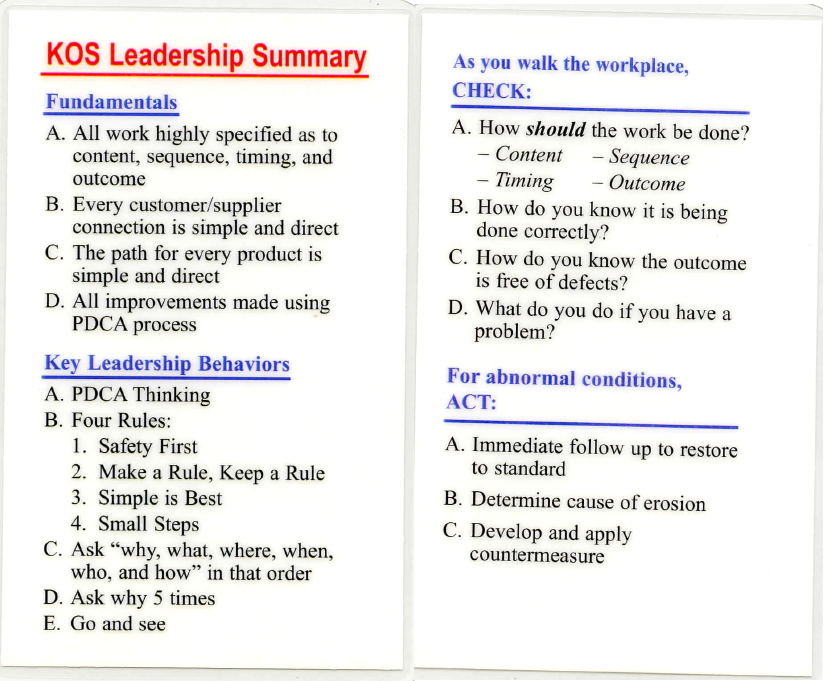
I was going through some old files and came across a pocket card we handed out back in 2003 or so. It was used in conjunction with our “how to walk the gemba” coaching sessions that we did with the lean staff, and then taught them to do with leaders.
A lot has happened, a lot has been learned since then. Toyota Kata has been published, and that alone has focused my technique considerably (to say the least).
Nevertheless, I think the elements on these little cards are valuable things to keep in mind.
With that being said, a caveat: Lists like this run the risk of becoming dogma. They aren’t. There are lots of lists like this out there, and the vast majority are very good. The key here is something that a leader or team member can refer to as a reminder that may bias a decision in the right direction. It is the direction that matters, not the reminders.
Fundamentals
The fundamentals are based on the “Rules-in-Use” from Decoding the DNA of the Toyota Production System, a landmark HBR article by Steve Spear and H. Kent Bowen. The article, in turn, summarizes (and slightly updates) Spear’s findings from his PhD work studying Toyota.
A. All work highly specified as to content, sequence, timing, and outcome.
B. Every customer-supplier connection is simple and direct.
C. The path for every product is simple and direct.
D. All improvements are made using PDCA process.
What we left off, though, is that in each of those rules there is a second one: That all of these systems are set up to be “self diagnostic” – meaning there are clear indications that immediately alert the front line people if:
The work deviates from what was specified.
The connection between a customer and supplying process is anything other than specified.
The path a product follows deviates from the route specified.
Improvements are made outside of a rigorous PDCA (experimental) process.
In other words, the purpose of the rules is to be able to see when we break them, or cannot follow them, so we trigger action.
To put this into Toyota Kata-speak – every process is set up as a target condition that is being run as an experiment – even the process of improvement itself!
Every time there is a disruption – something that keeps the process from running the way it is supposed to – we have discovered an obstacle. That obstacle must first be contained to protect the team members and community (safety) and to protect the customer (quality). Then goes into the obstacle parking lot, and addressed in turn.
If you think about it, the Improvement Kata simply gives us much more rigor to (D).
This ties to the next sections.
Key Leadership Behaviors
Note that this is behaviors. These are things we want leaders to actually strive to do themselves, not just “support.” It was the job of the continuous improvement people to nudge, coach, assist the leaders to move in these directions. It was our job to teach our continuous improvement people how to do that coaching and assisting – beyond just running kaizen events that implement tools.
A. PDCA Thinking
Today we would use Toyota Kata to teach this. But the same structure drove our questioning back then.
B. Four Rules:
1. Safety First
Even though this should be obvious, it is much more common that people are tacitly, or even directly, asked to overlook safety issues for the sake of production. I remember walking through a facility with a group of managers on the way to the area we were going to see. Paul stopped dead in his tracks in front of a puddle on the floor. He was demonstrating just how easy it was for the leadership to walk right past things that should be attended to. And in doing so, they were sending the message – loud and clear in their silence – that having a puddle on the floor was OK.
2. Make a Rule, Keep a Rule
This is a more general instance of Rule #1. But the it is more subtle than it may seem on the surface. Most people immediately interpret this as enforcing organizational discipline, but in reality it is about managerial discipline.
Nearly every organization has a gap between “the rules” and how things really are day-to-day. Sometimes that gap is small. Sometimes it is huge.
Often “rules” are enforced arbitrarily, such as only cases where a violation led to a bigger problem of some kind. Here’s an example: Say your plant has a set of rules about how fork trucks are to be operated – speed limits, staying out of marked pedestrian lanes, etc. But in general the operators hurry, cut a corner now and then. And these violations are typically overlooked… until there is some kind of incident. Then the operator gets written up for “breaking the rules” that everyone breaks every day – and management tacitly encourages people to break every day by focusing on results rather than process.
When we say “make a rule / keep a rule” what we mean is if you aren’t willing to insist on a rule being followed consistently, then take the rule off the books. And if you are uncomfortable taking the rule off the books, then your only option is to develop something that you can stand behind. It might be simple mistake proofing, like physical barriers between forklift aisles and pedestrian aisles. But if you are going to make the rule, then find a way to keep the rule.
Do you have “standard work” documents that are rarely followed? Stop pretending you have standards or rules about how the work is done. Throw them away if you aren’t willing to train to them, mistake proof to them and reinforce following them.
3. Simple is Best
Simply, bias heavily toward the simplest solution that works. The fewest, simplest procedures. The simplest process flow. Complexity hides problems. “Telling people” by the way, is usually less simple than a physical change to the work environment that guides behavior. See above.
4. Small Steps
Again, Toyota Kata’s teaching covers this pretty well today. The key is that by taking small steps, verifying that they work, and anchoring them into practice before taking the next ensures that each step we take has a stable foundation under it.
The alternative would be to make many changes at once in the name of going faster.
We emphasized here that “small steps” does not equal “slow steps.” It is possible to take small steps quickly, and we found that in general doing so was faster than making big leaps. Getting big changes dialed in often required backing out and implementing one thing at a time anyway – just to troubleshoot! See “Gall’s Law” which states:
A complex system that works is invariably found to have evolved from a simple system that worked. A complex system designed from scratch never works and cannot be made to work. You have to start over, beginning with a working simple system.
John Gall, author of Systematics
and sums this up nicely.
C. Ask “Why, what, where, when, who, and how” in that order.
Here we borrowed the sequence from TWI Job Methods. The first two questions challenge whether a process step is even necessary: Why is it necessary? What is its purpose? To paraphrase Elon Musk, the greatest waste of time is improving something that shouldn’t even exist.
Then: Where is the best place? and When is the best time? These questions might nudge thinking about combining steps and further simplifying the process.
And finally we can ask Who is the best person? and “How” is the best method? The key point here is until we have the minimum possible steps in the simplest possible sequence, and understand the cycle times, it doesn’t make sense balance the work cycle or work on improving things.
Come to think about it – perhaps we should ask “How?” before we ask “Who” since improving the method will change the cycle times and may well inform out decisions about the work balance. Hmmm… I’ll have to think about that. Any thoughts from the TWI gurus?
D. Ask Why 5 Times
Honestly, this was a legacy of the times. Unfortunately it suggests that you can arrive at a root cause simply by repeatedly asking “Why?” and writing down the excuses answers that are generated. In reality problem solving involves multiple possible causes at each level, and each must be investigated. I talked about this in a post way back in 2008: Not Just Asking Why – Five Investigations.
E. Go and see.
Go and see for yourself. Taking this into today’s practice, I think it is something that the Toyota Kata community might emphasize a little more. We tend to ask the question “When can we go and see what we have learned…?” but all too often the answer to “What have you learned?” is a discussion at the board rather than actually going and observing. Hopefully the board is close to where the improvement work is being done. Key point for coaches: If the learner can’t show you and explain until you understand, it is likely the learner’s understanding could be deeper.
As You Walk The Workplace:
Check:
perhaps we should have said “Ask…” rather than “Check” but asking and observing are ways to “check.” All of the below are things that the leader walking the workplace must verify by testing the knowledge of the people doing the work.
A. How should the work be done? Content, Sequence, Timing, Outcome
This is another nod to the research of Steven Spear. The key point here is that before you can ask any of the following questions, you have to have a crisp and precise of what “good” looks like. In this paradigm, all processes are target conditions. And as the work is being done, we are actively searching for obstacles so we can work to make the work smoother and more consistent.
In other words, “What should be happening?” and “How do you know?”
Do the people doing the work understand the standard process as it should be done?
A few months ago I went into some depth on this here: Troubleshooting by Defining Standards. That probably isn’t the best title in retrospect, but there are too many links out there that I don’t want to break by changing it.
B. How do you know it is being done correctly?
Today I ask this question differently. I ask some version of “What is actually happening?” followed by “How can you tell?” We want to know if the people doing the work have a way to compare what they are actually doing against the standard.
C. How do you know the outcome is free of defects?
So, question B asks about consistency of the process, and question C asks about the outcome. Does the team member have a way to positively verify that the outcome is defect-free?
D. What do you do if you have a problem?
Again, we are checking if there is a defined process for escalating a problem. And we define “problem” as any deviation from the standard, or any ambiguity in what should be (or is) happening. We want someone to know, and act, on this, and the only way that is going to happen is to escalate the problem.
We want this process to be as rigorous and structured as the value-adding work.
And we want as much care put into designing production process as was put into designing the product itself. All too often great care and a lot of engineering time goes into product design, and only a casual pass is made at designing and testing the process.
Even better if these are done simultaneously where one informs the other.
For Abnormal Conditions:
ACT:
These are actions that the leader must take if she finds something that isn’t “as it should be” in the course of the CHECK questions above. Key Point: These are leadership actions. That doesn’t mean that the leaders personally carry them out, but the leaders are personally responsible for ensuring that these things are done – and checking again.
That is the only way I know of to prevent the process from continuing to erode.
A. Immediately follow up to restore the standard.
If it isn’t possible to get the intended standard into back place, then get a temporary countermeasure into place that ensures safety and quality.
B. Determine the cause of erosion.
We are talking about process erosion here, with the assumption that something knocked the process off its designed standard. Some obstacle has been discovered, we have to better understand what it is – at least enough to get it documented.
C. Develop and apply countermeasure.
Here we may have to run experiments against this newly discovered obstacle and figure out how to make the process more robust.
That is the end of the little card. But I want to point out that we didn’t just hand these out. You got one of these cards after time paired with a coach on the shop floor practicing answering and asking these questions. Only after you demonstrated the skill did you get the card – just as a reminder, not as a detailed reference. This exercise was inspired by a few of us who had experiences “in the chalk circle” especially with Japanese senseis who had been direct reports to Taiichi Ohno.
We piloted and developed this process on a very patient and willing senior executive – but that is another story for another day. (Thank you once again, Charlie. I learned more from you than you will probably ever realize.)
Outside of the actual operation, the default meeting schedule for most organizations is weekly.
This is OK when everyone understands what is expected and the default thinking and behavior is working for you.
With Toyota Kata, though, the intent is to practice a routine that is not default thinking or behavior. Yet many organizations fall into the default of a weekly coaching cycle.
What we have to remember is that the coaching cycle, and the learner’s preparation for the coaching cycle, are practice. The time(s) that you aren’t practicing you are engaging in the default, and if the default isn’t what you want it to be then it will easily overpower what you are trying to learn.
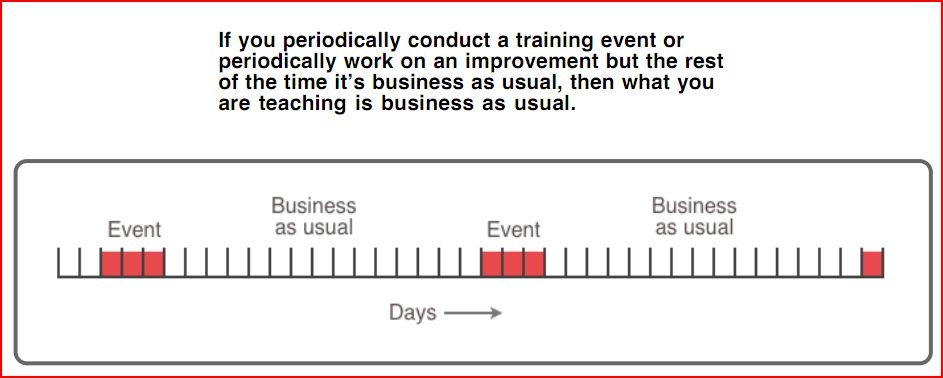
15 minutes a day is practice. 15 minutes a week is dabbling.
It is the same as a supervisor’s area experiencing one or two “kaizen events” a year. It is just dabbling with kaizen, not practicing it every day, and certainly not immersion. They aren’t going to learn to think differently with that kind of cadence.
Illustration courtesy of Mike Rother
Batch Production of Experiments
One of the reasons we want to drive toward one-by-one flow in production is so we can have one-by-one confirmation of products vs. waiting for a huge batch to be produced only to discover that they all have problems.
Breaking it down even further, we want one-by-one confirmation of operations so that we don’t keep working on something that is already unusable from something earlier.
Likewise, if a learner is running many experiments without checking in with a coach, he can get pretty far off track without realizing it. The coach can provide a valuable outside check to make sure the learner isn’t getting locked on to something that is distracting him from the bigger picture.
Remember: This is about developing people
Before you jump in and say “But I don’t have time…” consider the alternative.
How much time do you, as a manager, spend intervening in problems that you think people should be able to solve on their own? If you keep giving them the answers, they are going to keep brining those issues to you.
With a little bit of thinking, the Coaching Kata cycle can be easily spliced on to David Marquet’s “Ladder of Leadership” and guide your conversations away from intervention and toward creating able problem solvers.
But before you can do that well, you have to practice the Coaching Kata until asking those types of questions becomes second nature to you.
This isn’t all about the learner’s development! If you only practice coaching once a week, whatever your default is today will likely remain so tomorrow. Change requires repetition and practice.
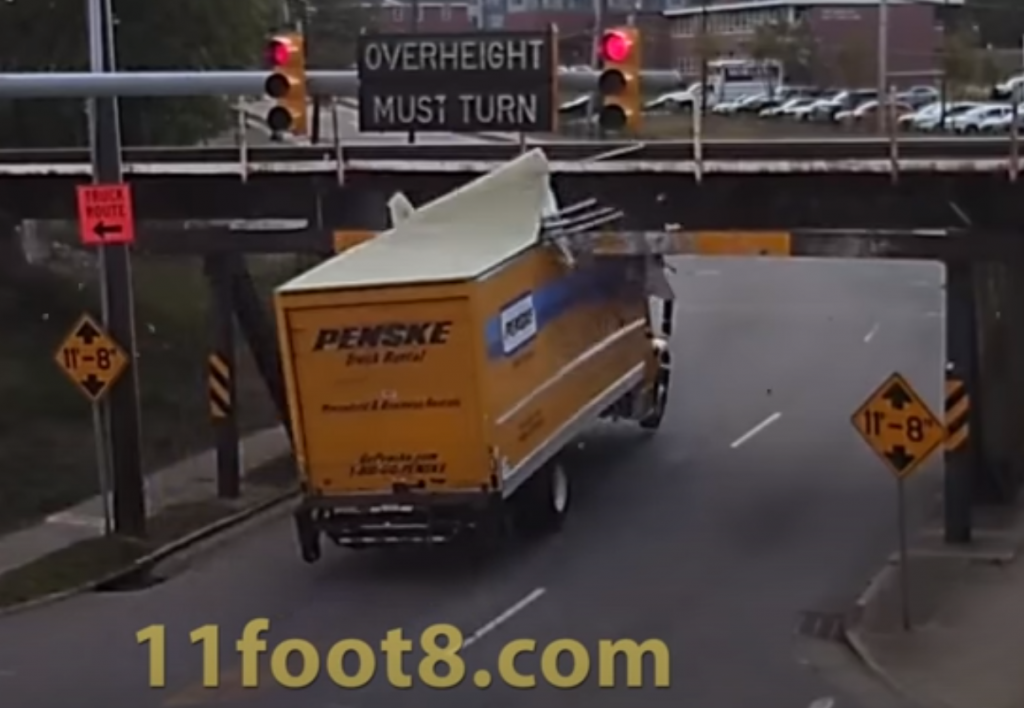
After yesterday’s post about trucks crashing into the famous 11foot8 bridge and mistake proofing, I got the feeling I should drive home my key point that the problem isn’t with the driver, it is with the environment.
As of this writing, Jürgen has recorded 154 crashes of overheight vehicles into the bridge.
And I’ll put even money that if all of the data were known, this process would pass any test for statistical control and we are getting what we should expect from a stable system. It might not be what we want, but it is what we should expect. (All images are copyright Jürgen Henn, 11foot8.com)
So addressing the individual incidents probably isn’t a solution. In any case, it is unlikely that any driver will repeat the mistake.* For the TWI folks – this isn’t really a Job Relations type of problem. It might feel like it is, but it isn’t.
In the Factory
I was working with a company with a similar problem. Their inspectors kept missing defects. The response was often to say “I don’t see how she could have missed that!” and even write them up for failure to do something that wasn’t particularly well specified.
But the fact on the ground was, like the bridge, the misses weren’t confined to any particular individuals, any particular shift, any particular anything. People missed things all of the time because the expectations greatly exceeded the limitations of what humans can do for 12 hours (or even one hour). It isn’t an inspection problem. (The reliance on inspection vs. upstream controls is another topic for another day.)
People Work Within a System
It is all too easy to fall into the “bad apple” fallacy and seek out someone who was negligent. It feels good, like we did something about the problem. But the problem will happen again, with someone else. Then I hear frustrated managers start to make disparaging comments about their entire workforce that “doesn’t care” about quality.
I challenged a quality manager to do that inspection job for two hours – not even a complete shift – under the watchful eye of the inspector whose job he was trying to do. Funny – he was a lot slower to assign blame after that experience. He couldn’t keep up.
Deming was pretty clear about the ineffectiveness of exhortation as a way to get better performance. “Be more careful!” might well work for one individual for a short time. “Making an example of someone” might well work for a group for a short time. But there are norms, and the system will return to those norms very quickly. There are simple limits to what humans can focus on and for how long.
The Bridge is a Metaphor
To be clear, the bridge represents a working system, but it is different than what we would find in a company. This is public infrastructure, and the truck drivers that get featured on the videos are not part of a single organization.
This means that you have more control than the city engineers in Durham do. You can establish procedures, ask questions, train people, have them practice, alert them to the Gregson Street Bridge on their route. You can make sure your navigation system routes your trucks around the low bridges. You can support your people so they are less likely to even end up in the situation. All of these are system changes – and that is what it will take to change the outcome.
Change the System: Raising the Bridge
In late 2019 the city of Durham, in coordination with the railroad who owns the bridge, did actually raise the bridge by 8 inches. It is now 11 feet 16 inches (3.76m).
And that is a legitimate approach. Rather than trying to create infallible humans, what can we do to make the system less vulnerable to fallible humans.
While that likely reduced the number of trucks that hit the bridge…
*Caveat: There is one video where a truck seems to avoid the bridge, then circle back around and hit it. And another video where a truck that hit this bridge then proceeded to run into another low bridge with the damaged truck.
Besides being a great source of schadenfreude, Jürgen Henn’s website, 11foot8.com offers some great insight in the difficulty of effective mistake-proofing.
Background
The clearance between the road and the railroad bridge at 201 Gregson Street in Durham, North Carolina is officially 11 feet 8 inches (3.55 meters).
A typical rental box truck is about 12 feet high (3.65 meters).
The result:
The more astute of you may have noticed the “OVERHEIGHT MUST TURN” sign just above the smashed truck.
Well before the truck approaches the intersection, it passes under a height sensor. If the vehicle is overheight, the OVERHEIGHT MUST TURN sign comes on and starts to flash, and the traffic lights turn red.
While this effort did mitigate the problem, obviously there are drivers who simply do not notice. Lots of them. Jürgen has cameras trained on the intersection and captures over a dozen crashes in a typical year. As a result, his website has attracted international attention. See the short documentary here: http://11foot8.com/about/the-documentary/
Familiar Tasks = “In the Zone”
The human brain is an amazing thing. It also works by deceiving us. It creates the illusion of complete awareness of the things around us when, in reality, we are simply aware of a model our brains have constructed of what we perceive to be there.
It is also an amazing engine at engaging actions based on pattern matching. For example –
In sessions I facilitate, I routinely ask people if they can recall a time when they arrived home after work but realized they didn’t remember driving the route. Nearly every hand in the room goes up. That is pretty amazing because driving is an incredibly complex task. But, assuming you get a license in your mid-teens, by the time you are in your early 20s, most people don’t give it much thought. (There is a reason your insurance rates drop when you turn 25.)
It has become a hard-wired neural pattern, a series of habits, a programmed set of responses that are operating below below the conscious and deliberate thinking part of the brain. This is really good because this process is much faster and more responsive than the alternative. Think about how it felt to be driving when you were just learning – or how it feels to be doing anything new when you are just learning.
The downside to this amazing programming is that things that don’t jar us into consciousness often go unnoticed.
And the more familiar, the more expert, we are with the task at hand, the more likely this will happen.
Levels of Mistake Proofing
I like to talk about three levels of mistake-proofing. Four actually, if you count Zero as a level.
Level 0 – the task must be performed correctly from memory.
Level 1 – there is a discrete task of checking build into the job.
Level 2 – there is an active indication when a mistake is about to be made (or has just been made and there is still time to correct without consequences).
Level 3 – there is active prevention that gets in the way of making the mistake.
The OVERHEIGHT MUST TURN sign is a Level 2. The driver has already passed signs informing him of the bridge clearance about 100m before the bridge.
The height sensors are on the poles just past the speed limit signs.
Low clearance signs about 100m before the bridge. (Google Street View)
Then in the next block, there is another sign telling the driver to turn:
Approaching the last intersection (Google Street View)
And finally the light changes and the OVERHEIGHT MUST TURN sign illuminates.
And still they miss it.
(Direct YouTube link for the email readers: https://youtu.be/I0BJmC6u7MU)
To be clear, the vast majority of truck drivers don’t hit the bridge. But over a dozen a year do. (There were more before the flashing sign was put in.)
“Pay Attention!” = Fundamental Attribution Error
As we watch Jürgen’s videos it is easy to assign character attributes to the drivers who hit the bridge. If only they were better drivers. (The vast majority people who are asked to rate their driving skill will say they are “above average” by the way. Think about that.)
But it is human nature to get lulled into a bit of complacency when engaging a routine task- and driving is a routine task in spite of the complexity.
Now – think about the people in your organization. How many opportunities to they have to make a mistake every day… every hour… in the course of their work? How many of those possible mistakes have serious or expensive consequences?
They are experts at what they do. And they don’t make many mistakes. And they usually catch themselves before there is a problem. But the Law of Large Numbers says “Given enough opportunities, the unlikely is inevitable.”
Can anyone reading this honestly say they have never inadvertently run a stop sign? Yet accidents rarely occur. Now and then there is some panic braking, and rarely there is a collision.
Yet it is really easy to single out the person who:
Performs the work the same way, in the same conditions as everyone else.
Makes the same mistakes, just as often, as everyone else.
Just like everyone else, usually they are caught in time, or other conditions aren’t present for a bad outcome.
But this time everything lined up and BANG – the defective product got missed, or the leak wasn’t noticed before the sump went dry.
Then that person gets singled out for “not following procedure” when nobody follows procedure.
Job Instruction “Key Points” = Opportunity
In a Job Breakdown for TWI Job Instruction we assign a “Key Point” as something the learner must remember specifically because it:
Might result in a hazard – injure the worker or someone else.
“Make or break the job” – if something isn’t done a specific way, the task fails.
Is a “knack” or technique that makes it easier to do.
Those first two are red flags. You are asking your team member to memorize critical to safety and critical to quality tasks. My challenge: How many of those key points can you “mistake proof” out of the job breakdown?
Finally – rather than the sensors and flashing lit signs, there is this approach from “somewhere on the Internet.”
That is awesome because even if the driver doesn’t see the sign, the BANG! may get his attention in time for it to register and stop. In the Durham, NC example above, apparently this wouldn’t work because there are legitimate reasons for trucks to come down the street up to the intersection just before the bridge. After that, it is really too late unless the driver is already aware that he has to turn.